Huijuan Guo1, 3,Jinchang Xu2, Zhenyou Wang2,Yunpeng Wang3
1. Shenyang Center of China Geological Survey, Shenyang 110034, China
3. State Key Laboratory of Deep Earth Processes and Resources, Guangzhou Institute of Geochemistry, Chinese Academy of Sciences, Guangzhou 510640, China
Vitrinite reflectance remains a highly reliable indicator for evaluating the thermal maturity of sedimentary basins. However, its application is restricted by uncertainties arising from variations in maceral composition, differing temperature and pressure conditions, and the absence of vitrinite in certain samples. Consequently, Raman spectroscopy has emerged as a promising alternative for thermal maturity assessment (Liu et al., 2013). Nevertheless, the strong fluorescence emitted by organic matter at low-to-medium thermal evolution stages severely limits the application of conventional Raman spectroscopy in determining the maturity of shales within these stages. Previous studies have utilized conventional and portable Raman spectrometers equipped with 514–532 nm excitation lasers to evaluate the maturity of low-to-medium mature Type II and III kerogens, primarily by optimizing Raman spectral post-processing methods (Sauerer et al., 2017; Schito et al., 2017; Stokes et al., 2023). Notably, spectral processing techniques significantly influence the accuracy of maturity estimation (Henry et al., 2019).
Shale oil productive formations frequently contain Type I organic matter, as exemplified by the Cretaceous Qingshankou Formation in the Songliao Basin. At low thermal evolution stages, Type I organic matter exhibits a markedly higher fluorescence intensity than Types II and III, often precluding the acquisition of valid Raman spectral data. Time-gated Raman spectroscopy (TGR) and surface-enhanced Raman spectroscopy (SERS) can effectively suppress fluorescence backgrounds, enabling the extraction of usable Raman signals. These techniques have been widely applied in fields such as environmental monitoring, food safety, and biomedicine. In this study, TGR and SERS were employed to characterize the thermal maturity of low-to-medium mature Type I kerogen and its artificially matured asphaltenes, respectively. Low-maturity shale samples rich in Type I organic matter from the Cretaceous Qingshankou Formation were subjected to high-pressure gold-tube pyrolysis experiments to generate a series of kerogen and asphaltene residues with varying thermal maturities. The research results indicate that:
(1) Compared with conventional Raman spectroscopy, the SERS technique significantly suppresses the fluorescence background of asphaltenes derived from the pyrolysis of Type I kerogen (Fig. 1). SERS parameters extracted from the asphaltenes demonstrate a strong correlation with the calculated vitrinite reflectance (EasyRo) values (0.65–1.54%) of the source rocks. It was observed that the full width at half maximum of the G band (FWHM-G) decreases systematically with increasing thermal maturity (Fig. 3d). This suggests a reduction in both the bond-angle disorder of sp2 sites and the sp3 carbon content within the highly disordered structure. Furthermore, as maturity increases, the FWHM-D/FWHM-G ratio of the asphaltenes increases (Fig. 3e), while the size of the aromatic sheets decreases. These structural transformations are consistent with previously reported evolutionary trends for kerogen. These SERS measurements demonstrate that asphaltene analysis holds significant potential for reducing uncertainties in the thermal maturity assessment of both source rocks and crude oils.
(2) Time-gated Raman spectroscopy (TGR) can substantially mitigate the fluorescence background of low-to-medium mature Type I kerogen (Fig. 2). Within the EasyRo range of 0.5% to 1.0%, the Raman band separation (RBS) between the G and D bands increases significantly with rising EasyRo. Beyond 1.0%, the variation becomes marginal, and the RBS values enter a plateau phase (Fig. 4). This evolutionary trend is highly consistent with previously documented relationships for Type II kerogen. The dynamic range of RBS values for Type I kerogen is comparably broad to that of Type II kerogen. Consequently, utilizing the RBS parameter provides a reliable approach for assessing the thermal maturity of Type I kerogen at low-to-medium evolution stages.
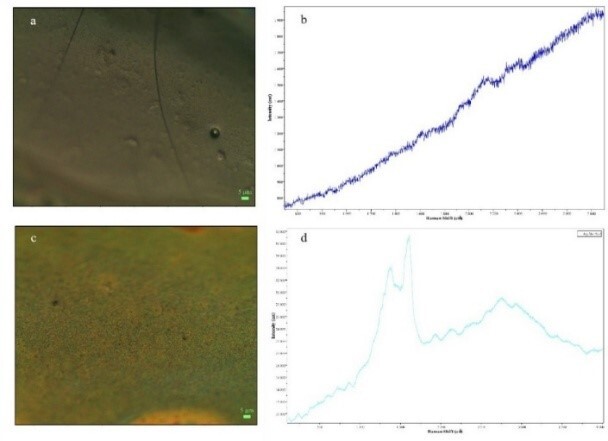
Figure 1. Reflected-light optical images and corresponding conventional Raman spectra of asphaltenes (a, b); reflected-light images and SERS spectra of asphaltenes deposited on the SERS substrate (c, d).
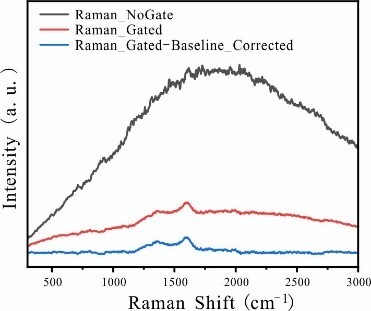
Figure 2. Comparison of the raw and processed time-gated Raman spectra with conventional Raman spectra.
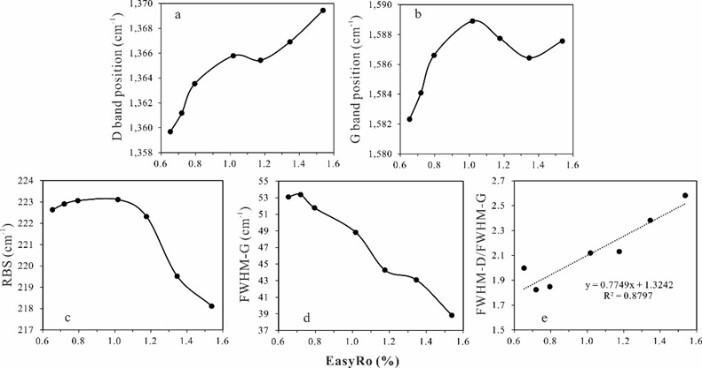
Figure 3. Variations of the SERS-derived D band position (a), G band position (b), RBS (c), FWHM-G (d), and FWHM-D/FWHM-G ratio (e) with increasing EasyRo.
study, TGR and SERS were employed to characterize the thermal maturity of low-to-medium mature Type I kerogen and its artificially matured asphaltenes, respectively. Low-maturity shale samples rich in Type I organic matter from the Cretaceous Qingshankou Formation were subjected to high-pressure gold-tube pyrolysis experiments to generate a series of kerogen and asphaltene residues with varying thermal maturities. The research results indicate that:
(1) Compared with conventional Raman spectroscopy, the SERS technique significantly suppresses the fluorescence background of asphaltenes derived from the pyrolysis of Type I kerogen (Fig. 1). SERS parameters extracted from the asphaltenes demonstrate a strong correlation with the calculated vitrinite reflectance (EasyRo) values (0.65–1.54%) of the source rocks. It was observed that the full width at half maximum of the G band (FWHM-G) decreases systematically with increasing thermal maturity (Fig. 3d). This suggests a reduction in both the bond-angle disorder of sp2 sites and the sp3 carbon content within the highly disordered structure. Furthermore, as maturity increases, the FWHM-D/FWHM-G ratio of the asphaltenes increases (Fig. 3e), while the size of the aromatic sheets decreases. These structural transformations are consistent with previously reported evolutionary trends for kerogen. These SERS measurements demonstrate that asphaltene analysis holds significant potential for reducing uncertainties in the thermal maturity assessment of both source rocks and crude oils.
(2) Time-gated Raman spectroscopy (TGR) can substantially mitigate the fluorescence background of low-to-medium mature Type I kerogen (Fig. 2). Within the EasyRo range of 0.5% to 1.0%, the Raman band separation (RBS) between the G and D bands increases significantly with rising EasyRo. Beyond 1.0%, the variation becomes marginal, and the RBS values enter a plateau phase (Fig. 4). This evolutionary trend is highly consistent with previously documented relationships for Type II kerogen. The dynamic range of RBS values for Type I kerogen is comparably broad to that of Type II kerogen. Consequently, utilizing the RBS parameter provides a reliable approach for assessing the thermal maturity of Type I kerogen at low-to-medium evolution stages.
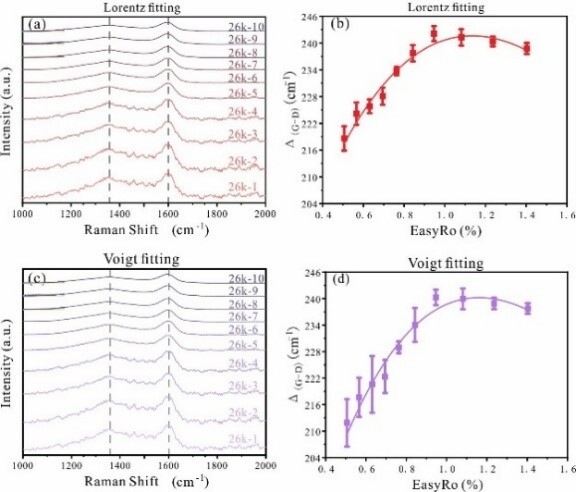
Figure 4. Lorentzian and Voigt fitting results of the time-gated Raman spectra (a, c), and the evolution of RBS with increasing thermal maturity (b, d).
References
[1] Liu, D.H., Xiao X.M., Tian H., Min Y.S., Zhou, Q., Cheng, P., Shen, J.G., 2013. Sample maturation calculated using Raman spectroscopic parameters for solid organics: Methodology and geological applications. Chin Sci Bull 58, 1228-1241.
[2] Schito, A., Romano C., Corrado, S., Grido, D., Poe, B., 2017. Diagenetic thermal evolution of organic matter by Raman spectroscopy. Organic Geochemistry 106, 57–67.
[3] Stokes, M.R., Jubb, A.M., Hackley, P.C., Birdwell, J.E., Barnhart, E.P., Scott, C.T., Shelton, J.L., Sanders, M.M., Hatcherian, J.J., 2023. Evaluation of portable Raman spectroscopic analysis for source-rock thermal maturity assessments on bulk crushed rock. Inernational Journal of Coal Geology 278, 104374.
[4] Henry, D.G., Jarvis, I., Gillmore G., Stephenson, M., 2019. A rapid method for determining organic matter maturity using Raman spectroscopy: Application to Carboniferous organic-rich mudstones and coals. Inernational Journal of Coal Geology 203, 87–89.